OpenCV Workshop
It contains more than 2500 optimized algorithms!
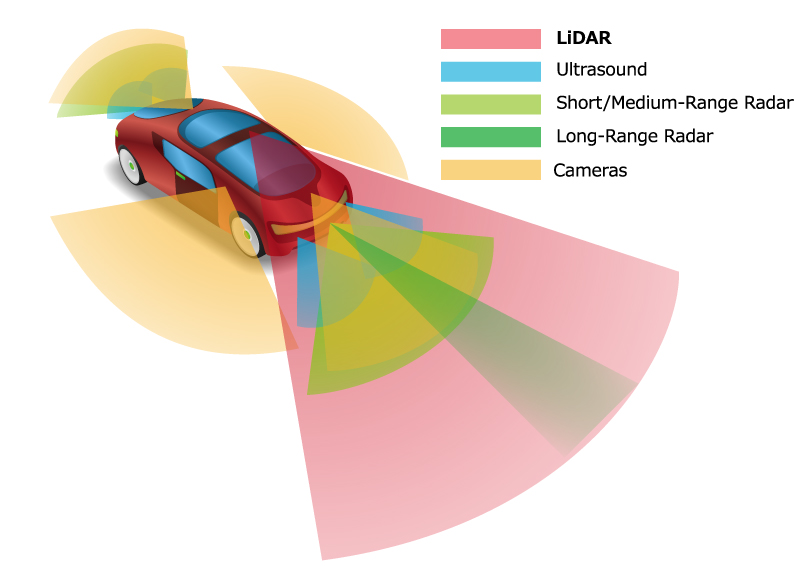
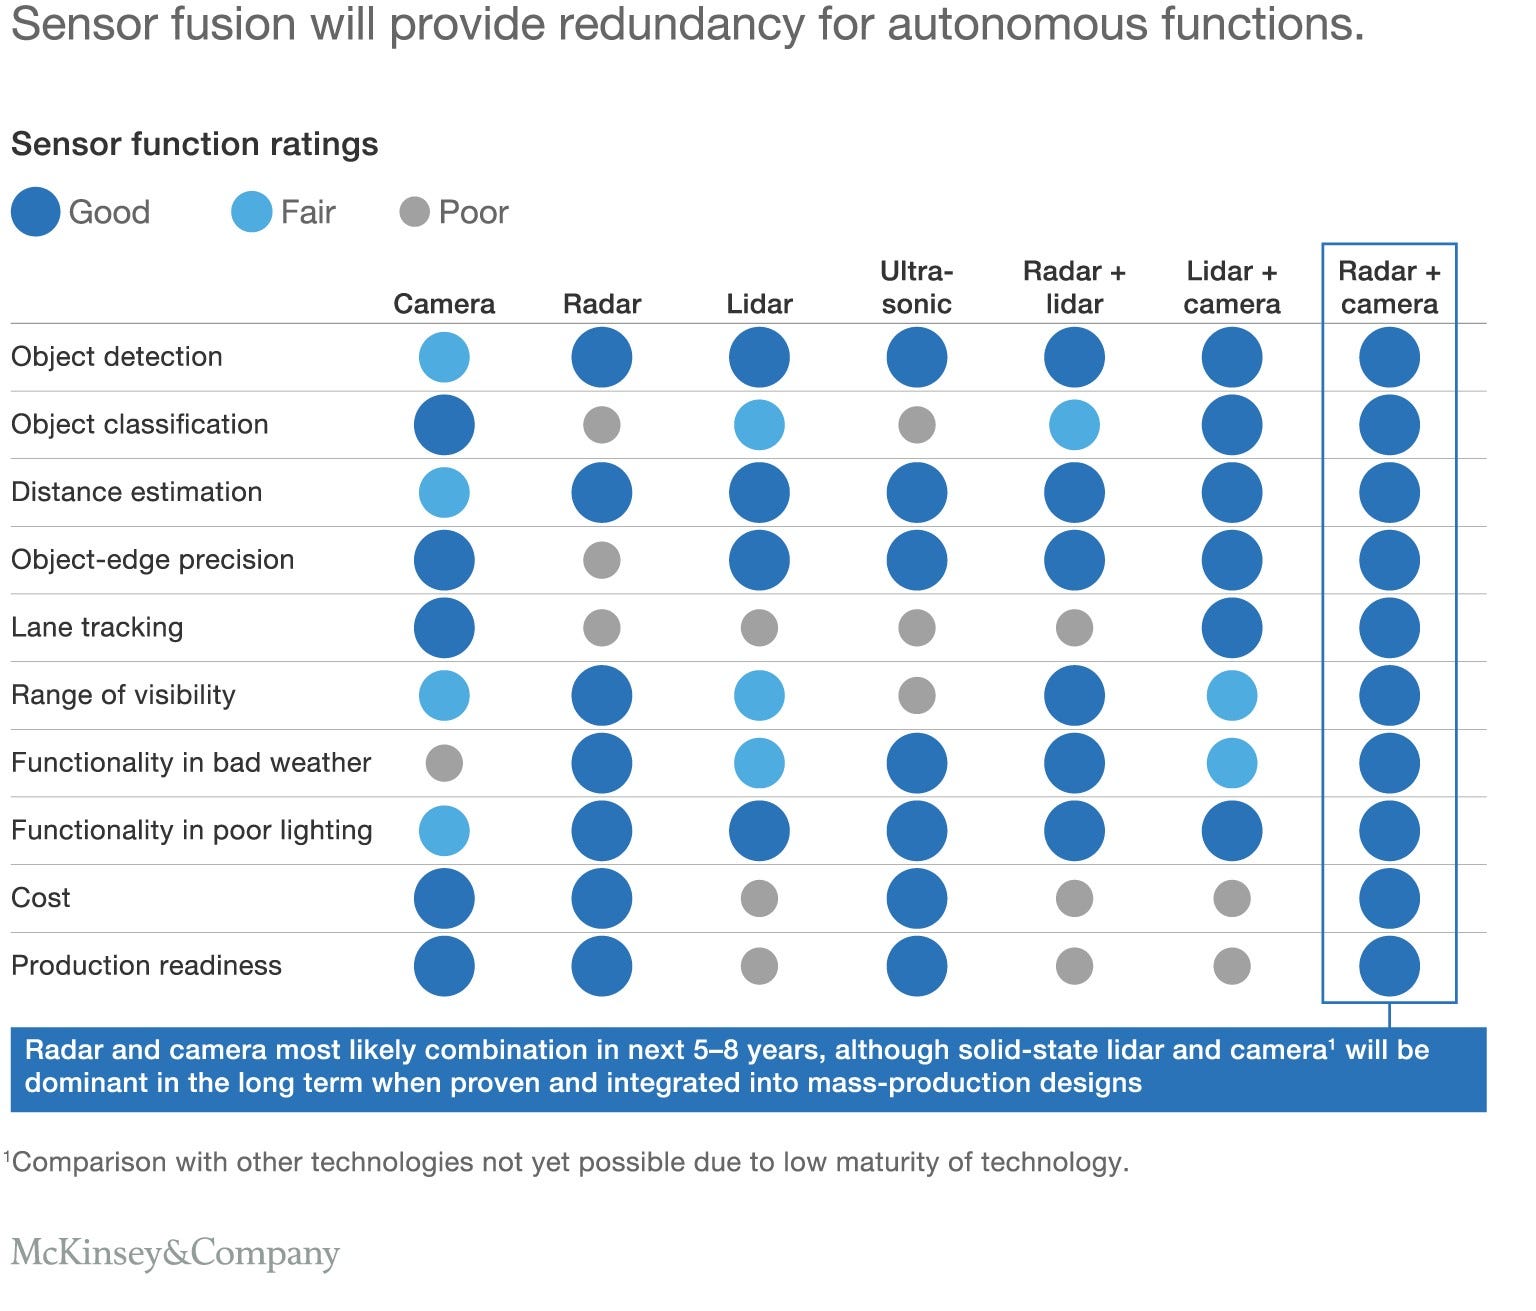
sensors emitting different frequencies of EM waves
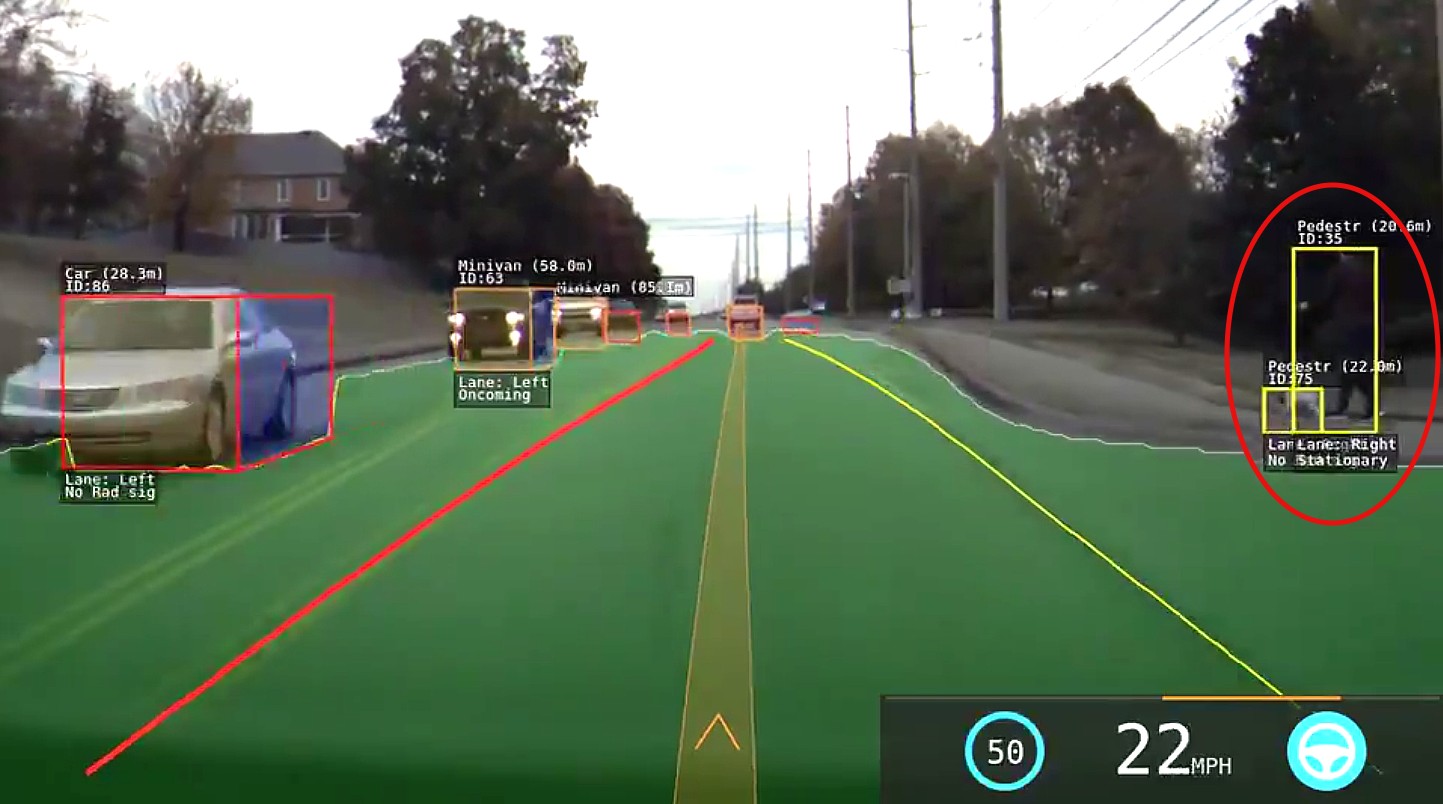 Tesla's Computer vision
Applications of computer vision
- Human and Technological Interaction (Gestures Recognition)
- Method of (secure?) authentication (facial recognition) --> Intruders?
- Detecting of safety lapses/building construction in engineering
- Self-driving cars
- And many more...!
Installing OpenCV
We can either install from the original source or....
Install using PIP! Pip is a package manager, which helps you to easily setup and get access to python libraries
Yes libraries! Python has many well developed libraries by the community.
Now Let's open up your terminal

The following slides are:
Windows Users, scroll right down..
Alternatively, click on its logo or open it from the menu.
Terminal commands
Showing items in your current directory
ls(List)>> Desktop Documents Home Downloads Music cdUse this code to navigate to another directorycd DocumentsNavigating to the "Documents Directory" cd ..Navigating out of the current directoryThe following slides are:
Mac Users, scroll right down for the task below
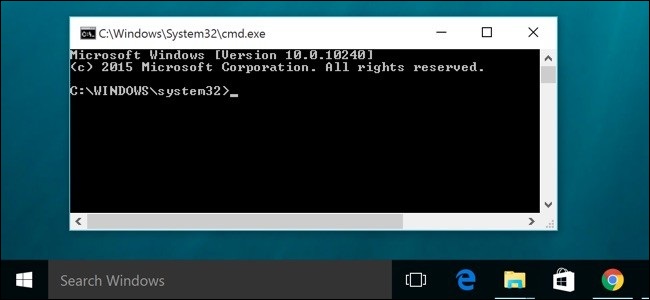
Press the Windows Key and type cmd
Alternatively, press "Windows button-r" and type cmd. Press enter.
Command Prompt (CMD) commands
Showing items in your current directory
dir(List)>> Desktop Documents Home Downloads Music cdUse this code to navigate to another directorycd DocumentsNavigating to the "Documents Directory" cd ..Navigating out of the current directoryInstalling OpenCV
python --versionCheck for python install. It should be python3!pip install matplotlibInstalling Matplotlib Visualization Librarypip install numpyInstalling Numpy Library for managing large arrays and perform math operationspip install opencv-pythonInstalling Open CV LibraryRefresher to Python
Printing(displaying) things in python
You can print a value directly or the variable, depending on the use case.
For example, printing the value directly:
print("Who here is familiar with Python?") >>> Who here is familiar with Python?Or declaring the data as a variable and printing the variable:
number = 12345
print(number) >>> 12345
running = FalseBoolean variable (True or False)RAM = 4Integer variableCPU_GHZ = 1.5Float variablename = "Raspberry Pi"String variabletools = ["Mouse", "Keyboard", "Monitor", "HDML Cable", "Micro USB Power Cable", "Micro SD Card"]Array (An array in Python can contain any types of variables,
be it integer, float, or string, or even all at once.)
How to check if variables meets a certain criteria?
if RAM == 5: # Conditional statement
  print("A pi has 5GB of RAM.")
elif RAM == 4: # Second conditional statement
  print("A pi has 4GB of RAM.")
else: # If all the above is false
  print("I do not know...")
            If-elif-else conditionals & comments
Doing simple math on numbers in python.
(applies to both integers and floats)
x = 10Additionprint(x + 8)18
Subtractionprint(x - 3.5)6.5
Multiplicationx * 2.626.0
Divisionx / 42.5
Note:
Please take note that some math operations may return unexpected types.
For example, 2.6*10 is expected to be 26 but python returns 26.0
Another thing to take note is that these expressions do not change the actual variable. For example:
x = 10
x + 10
print(x)10
To actually change the variable, assign the equation to the variable again. For example:
x = 10
x = x + 10
print(x)20
Doing more math on numbers in python.
(applies to both integers and floats)
RAM += 5Shorthand for "RAM = RAM + 5"RAM = RAM / 2Divison (returns a float if number has a remainder)RAM = RAM // 2Floor Division (returns an integer)RAM = RAM % 2Modulo (returns the remainder when RAM is divided by 2)
              def addition (a, b):
                result = a + b
                return result
              addition(3,5)
              >>> 8

            Call the function using "function_name(inputs)"
              def addition (a, b):
                result = a + b
                print(result)

            A function can also not return anything.
              for i in range (5):
                print(i)

            >>> 0 1 2 3 4
              for i in range (1, 10, 2):
                print(i)

              >>> 1 3 5 7 9
              name = "Raspberry"
              for char in name:
                print(char)

              >>> R a s p b e r r y
              name = "recording"
              while True:
                print(name)

              >>> recording
              .....
              >>> recording
Continues on infinitely
              import numpy
              import cv2
                Using pre-built functions from libraries.
Use OCR to detect words from an image. Hint: use the google library
the hardware
What is a Raspberry Pi?
A single board computer, which contains
- CPU
- Random Access Memory (RAM)
- Wifi/Bluetooth
So basically, like a regular computer but with some different features.
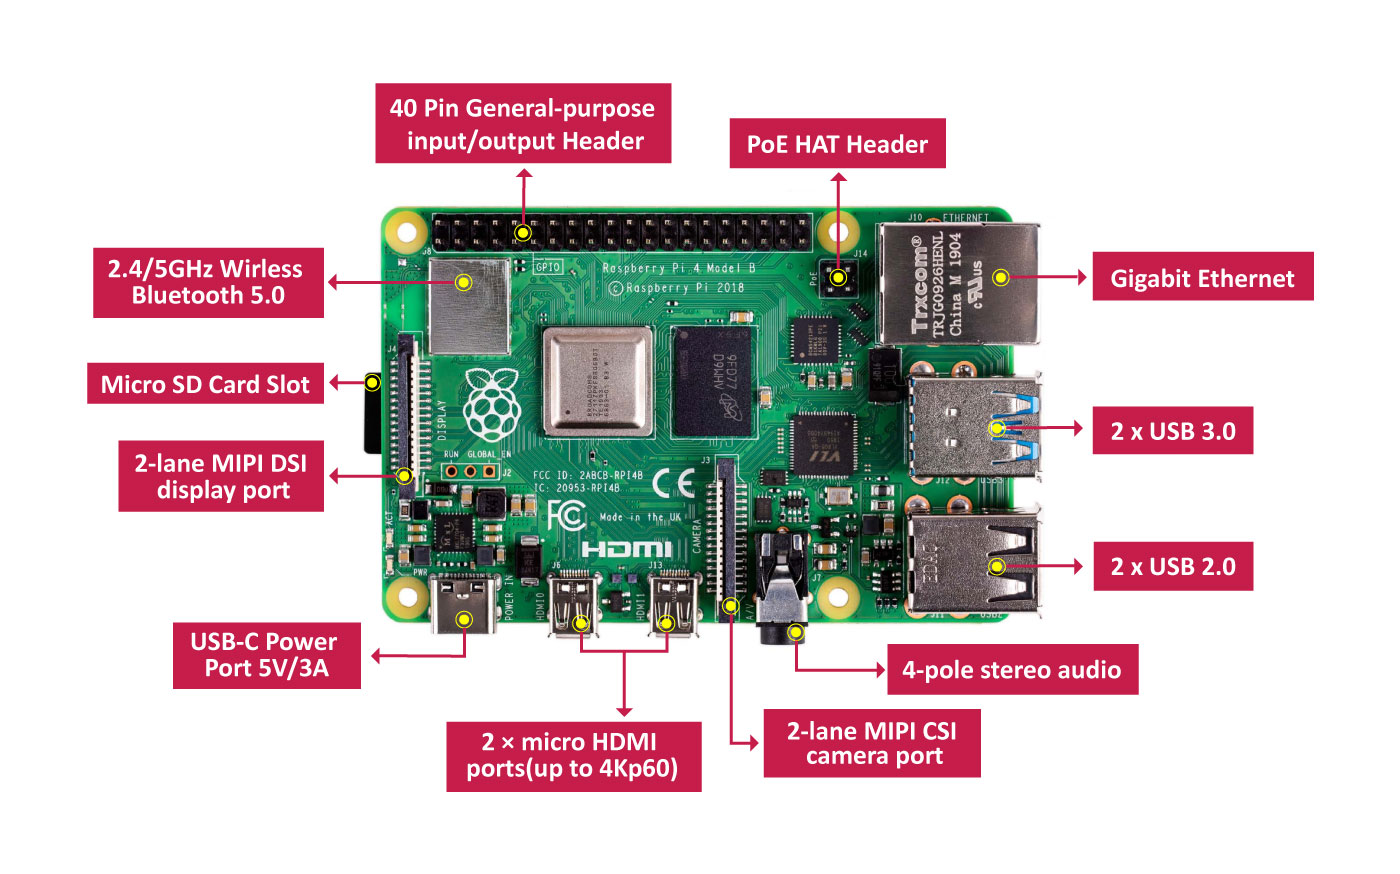 Hardware Overview (Raspberry Pi 4)
 Projects are found all over the internet
Raspbian OS
It is based off the open source Linux Distribution Debian
The software gives users great control over their computers
Histograms
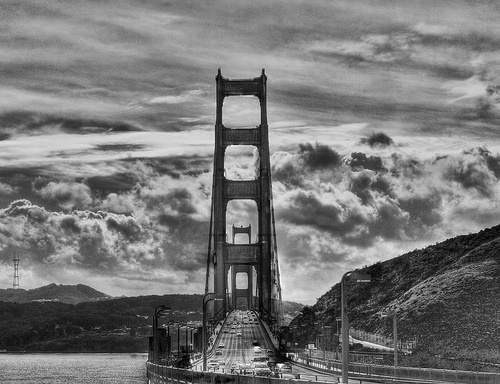


Each pixel has a brightness intensity value, showing how bright that spot in the image is.
giving rise to a total of 256 values.

Grayscale Histogram

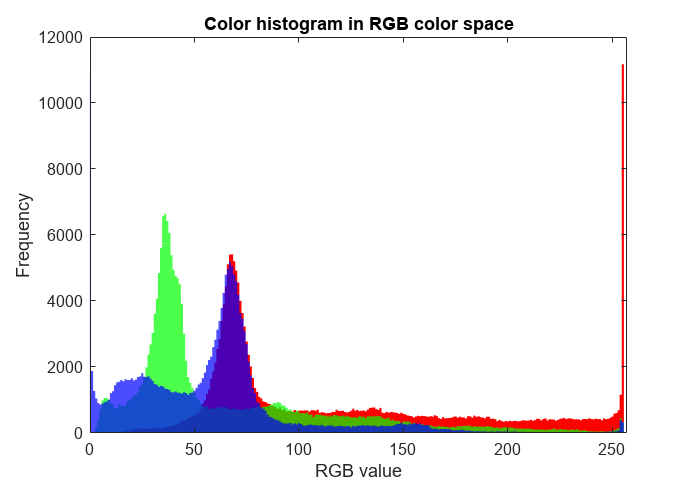
RGB Histogram
The X and Y-axis indicates the intensity and frequency of a certain color value respectively
Okay, but what do people even use histograms for?

It allows geographers and hydrologists to map out the intensity and analyse rainfall.

It allows photographers to check the exposure (how bright or dark) of an image
Let's start coding! We will ...
open files/live webcam video
display image/video histograms
1. Coloured histogram
2. Monochrome histogram
Using two differences sources:
1. Static image
2. Live or dynamic video
0, 1, 1, 2, 3, 3, 3, 3, 4, 5, 6, 6, 6, 7, 8, 8, 9
11 BINS:

0, 1, 1, 2, 3, 3, 3, 3, 4, 5, 6, 6, 6, 7, 8, 8, 9
6 BINS:

Static Histogram
Accepting image file using OpenCV
Colour:cap = cv2.imread("image.png")cap = cv2.imread("image.png", 0)Plotting histogram
plt.figure()
for i,col in enumerate(color): # for each color channel
    histr = cv2.calcHist([img],[i],None,[256],[0,256])
    plt.plot(histr,color = col)
    plt.xlim([0,256])
🛈 256 represents the intensity range of each pixel
plt.hist(cap.ravel(),256,[0,256])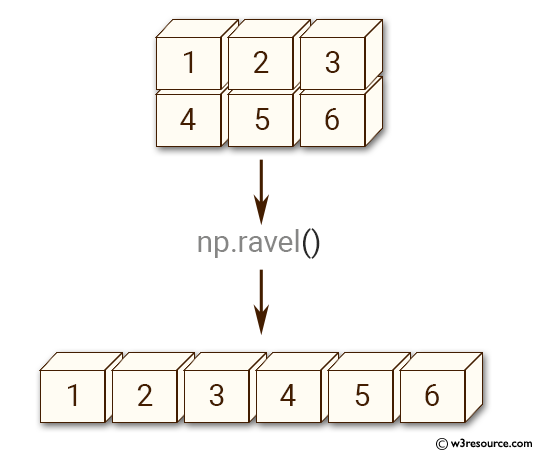
plt.show()Live Histogram
Accepting video file using OpenCV
cap = cv2.VideoCapture('video.mp4')cap = cv2.VideoCapture(0)😃
# continues running while video is on
while True:
	#write code from static histogram part here
❓ Place following lines of code in this loop
To show the whole video or webcam feed, this code needs to be put in a loop to display the latest frame constantly.
This is because a video is made of many frames.
WARNING: Code Explanation Ahead!
# refreshes the graph by pausing the graph
plt.pause(0.001)
''' add code here to give labels for x/y axis '''
''' add code here to show graph '''
plt.clf() # Clears the figure but keeps the window
End the code sequence with keyboard input "q"
if cv2.waitKey(1) & 0xFF == ord('q'):
	break
Gets the dimensions of the image and set a reasonable limit
# gets total number of pixels and sets arbitrary value
numpix =  int((img.shape[0]*img.shape[1])/30)
    Arbitrary, adjust if required.
Prevents y-axis from shifting due to change in video histogram
#get current axis and set a limit on the y values
plt.gca().set_ylim([0, numpix])
Trackbars
Importing essential modules
import numpy as np
						import cv2
🛈 What are these for? Not all are needed now
- Numpy is a useful mathematical library that allows us to
work easier with the large array of pixel information. - cv2 contans useful functions whose algorithms are efficient in processing images and video.
Creating the trackbars
frame = np.zeros((312, 500, 3), np.uint8)
cv2.namedWindow('trackbar')
🛈
cv2.createTrackbar('lowH','trackbar',0,179,nothing)
cv2.createTrackbar('highH','trackbar',179,179,nothing)

cv2.createTrackbar('lowS','trackbar',0,255,nothing)
cv2.createTrackbar('highS','trackbar',255,255,nothing)

cv2.createTrackbar('lowV','trackbar',0,255,nothing)
cv2.createTrackbar('highV','trackbar',255,255,nothing)
Getting trackbar position
#cv2.getTrackbarPos(trackbar_label, trackbar_window)
cv2.getTrackbarPos('lowH','trackbar')
🛈
h = cv2.getTrackbarPos('lowH','trackbar')
s = cv2.getTrackbarPos('lowS','trackbar')
v = cv2.getTrackbarPos('lowV','trackbar')
low(or high) = np.array([h,s,v])
What is HSV/HSL?
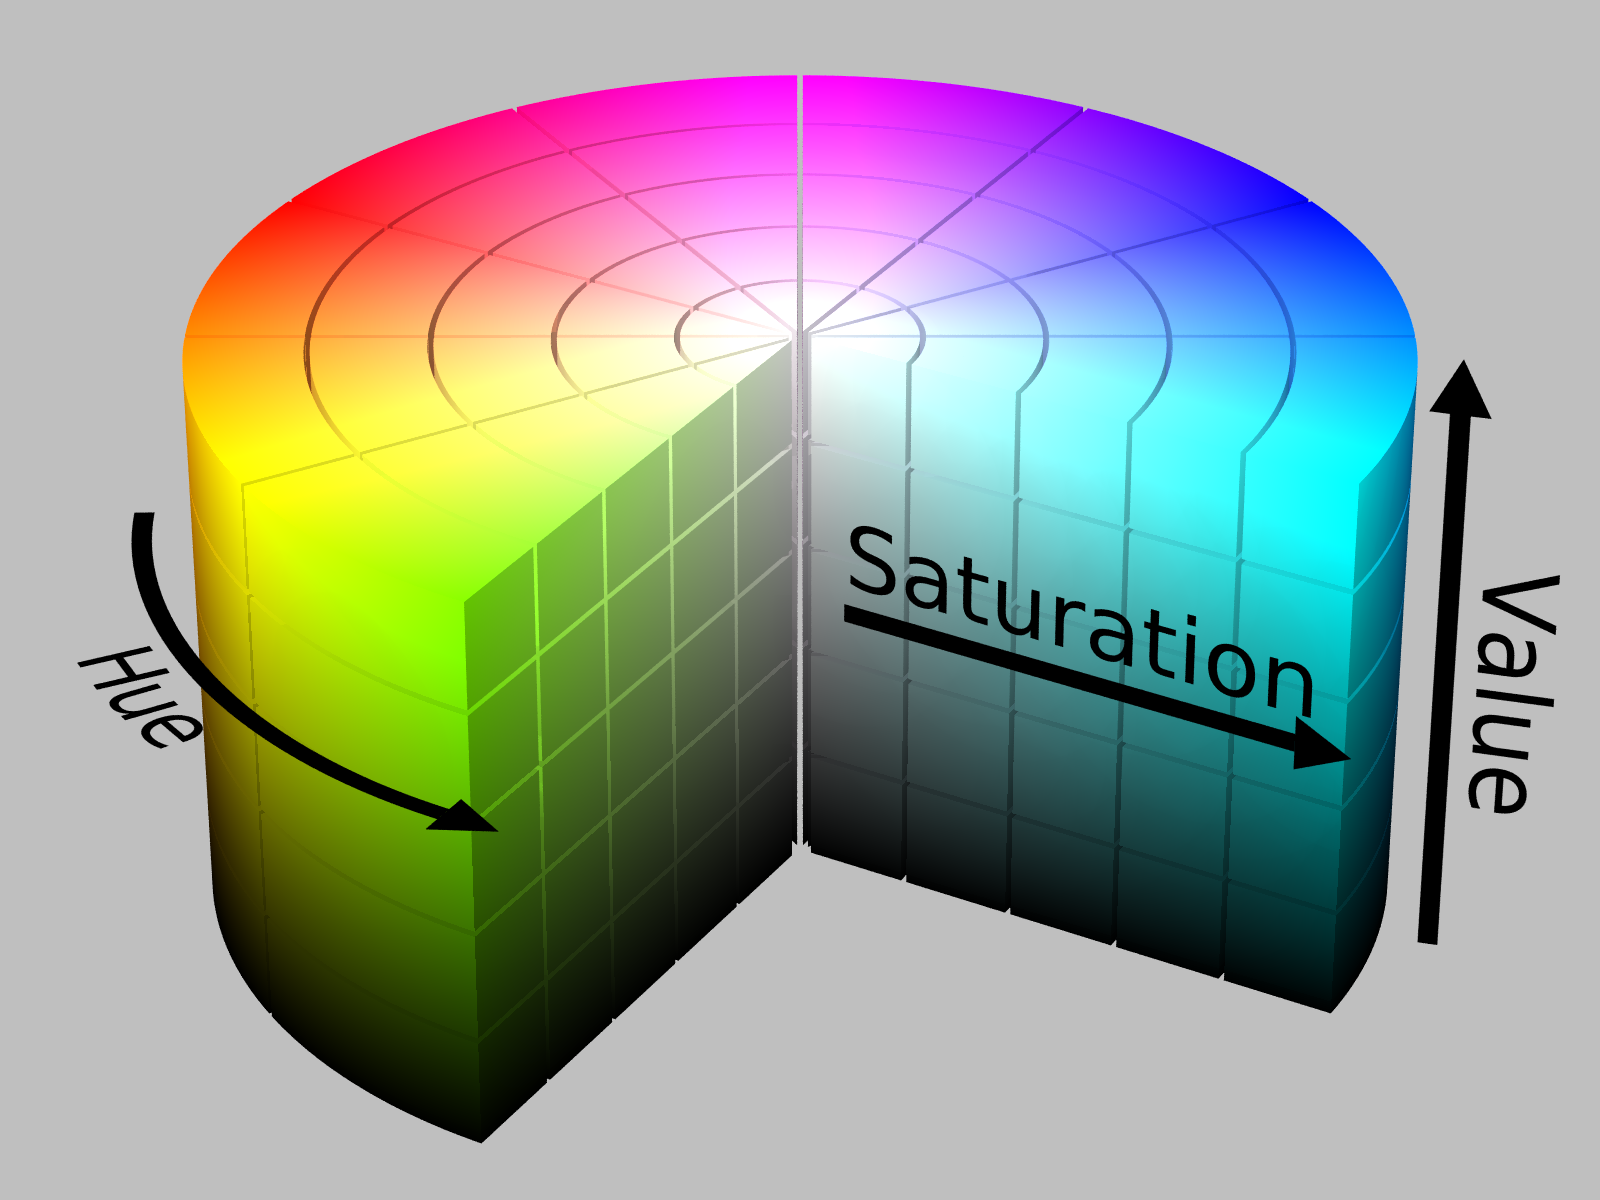
Process the Data
frame = cv2.cvtColor(frame, cv2.COLOR_BGR2HSV)🛈 cv2 stores and utilises images in the BGR format
mask = cv2.inRange(frame, low, high)res = cv2.bitwise_and(frame, frame, mask=mask)But wait!
cv2.bitwise_and()
res = cv2.cvtColor(res, cv2.COLOR_HSV2BGR)

cv2.imshow("mask", res)

if cv2.waitKey(1) == ord('q'):
    break
(Outside the while loop)
cap.release()
cv2.destroyAllWindows()
How it works

If we were to isolate the "red parts"....

Using a similar histogram idea, we can isolate a prominent colour with a mask
low_red = np.array([255,255,255])
high_red = np.array([255,0,0])
							Initialise a Numpy Array with Red, Green and Blue values
red_mask = cv2.inRange(hsv_frame, low_red, high_red)
inRange function creates a maskcontours, retrieveval = cv2.findContours(red_mask, cv2.RETR_TREE, cv2.CHAIN_APPROX_SIMPLE)
Using cv2 find Contours in-built librarycontours = sorted(contours, key = lambda x:cv2.contourArea(x), reverse=True)eg. [254, 252, 198...]Lambda Functions?
lambda arguments : expression
items = [3,5,5]
def addtoarray(items):
	for i in range(len(items)):
		items[i] = items[i]+1
	return items

addtoarray(items)
>>> [4,6,6]
Typical function to increment item in array map(function_object, iterable1, iterable2,...)
To map the Lambda Function to each value in the listprint(map(lambda k:k+1,items))
>>> map object 0xjijidje0r
This will produce a generator object, hence we use list() instead to iterate over the generated map objectMuch shorter code!
items = [3,5,5]
							print(list(map(lambda k:k+1,items)))
							>>> [4,6,6]
In the function, k is the argument for the lambda function, similar to items in the function above. The variable k is mapped to k+1 if len(contours)>0: #check if webcam has started recording
(x,y,w,h) = cv2.boundingRect(contours[0])
#takes the first values in the array
print("X_mid:",x+w/2,"Y_mid:",y+h/2) #optional
cv2.rectangle(frame,(x,y),(x+w,y+h), (0,255,0),2)
#inbuilt function for drawing rectangles
Documentation shows the function parameters
cv2.imshow("Tracking", frame)
    cv2.imshow("Mask over", red_mask)
if cv2.waitKey(1) & 0xFF == ord('q'):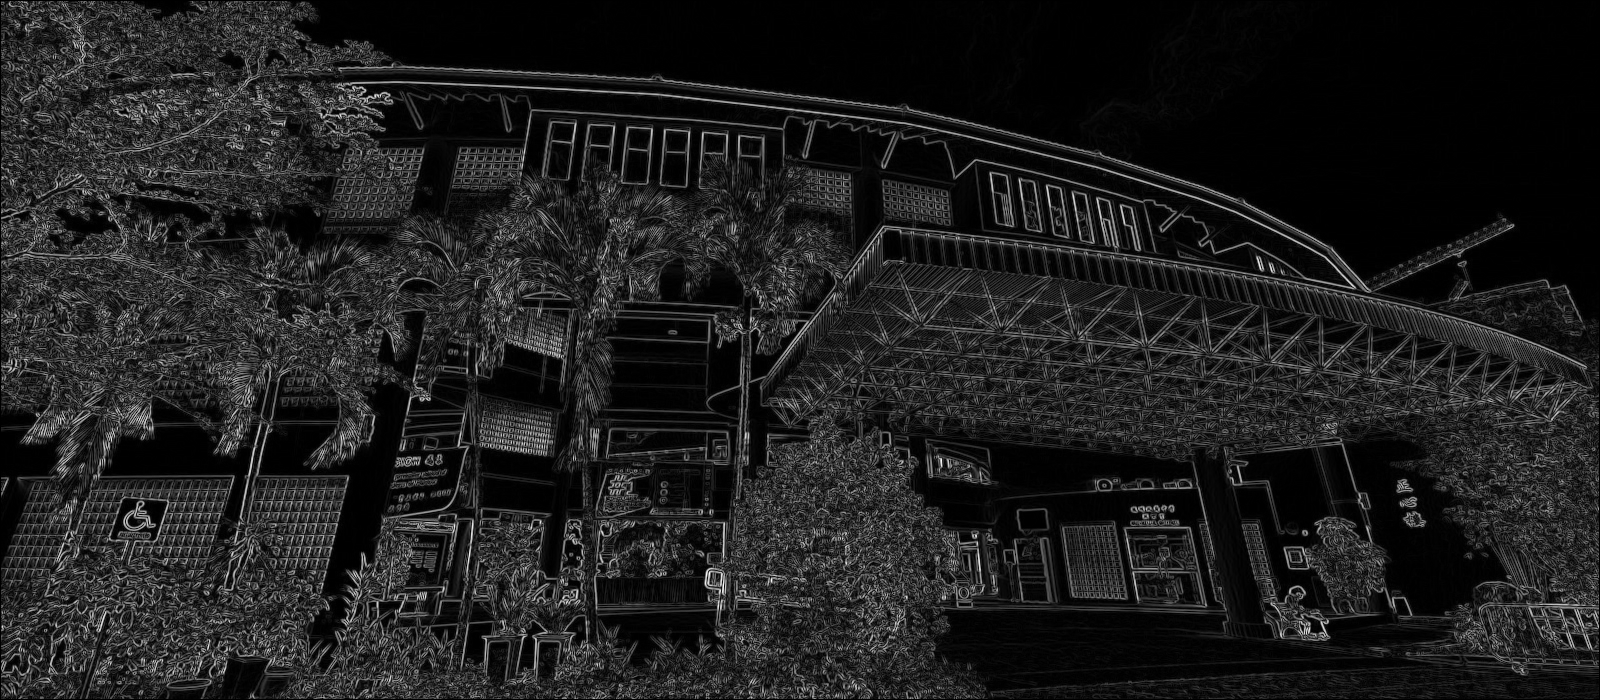
breakCanny Edge Detection
Canny Edge Detection is a popular edge detection algorithm. It was developed by John F. Canny in 1986.
- Noise reduction
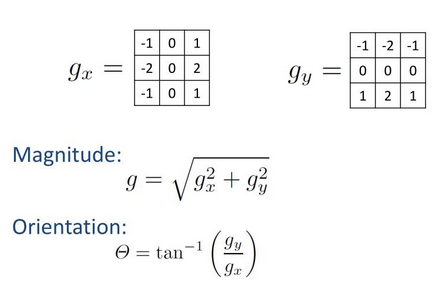
- Finding Intensity Gradient of the Image
- Non-maximum Suppression
- Hysteresis Thresholding

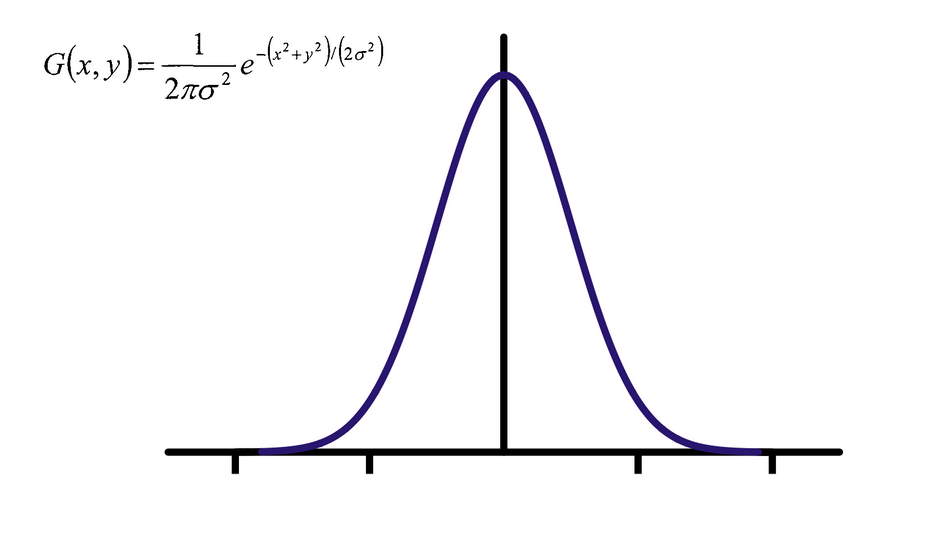
Gaussian Blur
An image smoothening techniqueGaussian functions are often used to represent the probability density function of a normally distributed random variable.

Finding intensity gradient
Applying the mask of the Sobel operator works like the 1st-order derivative.The goal is to calculate the difference of pixel intensities in a edge region.
Non-maximum Suppression
A full scan of image is done to remove any unwanted pixels which may not constitute the edge.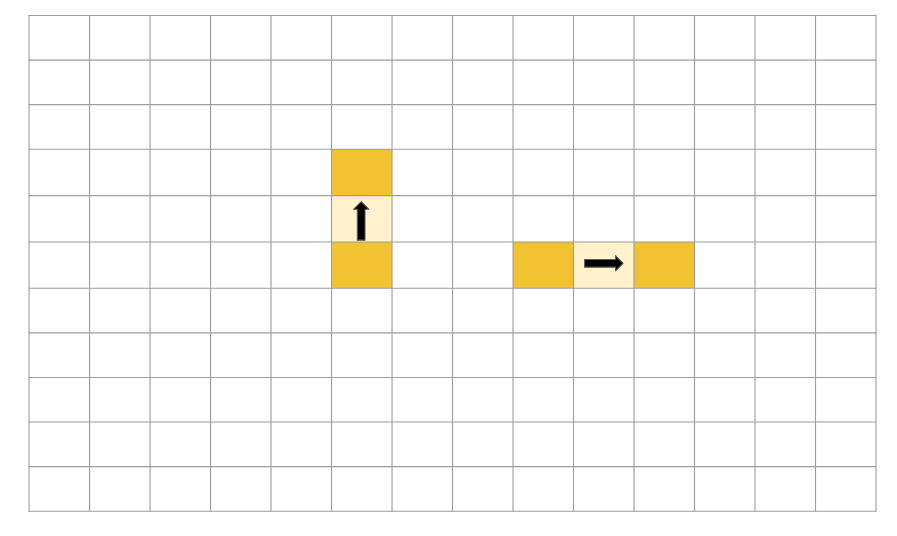
Hysteresis Thresholding
Finding the optimal value that constitute an edge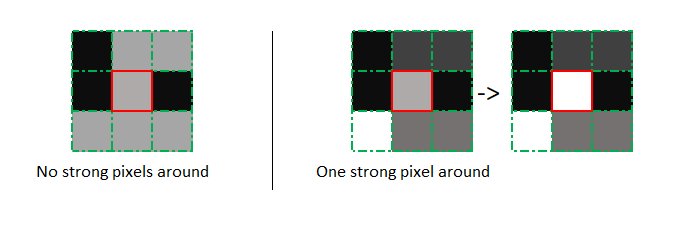

Thank you! Give yourself a pat on the back